Back to Innovator ~~~ Next article ~~~ Previous article
By Jonathon Zettler, Fieldwalker Agronomy
Have you been hearing about SWAT Maps and wondering what it means? Soil, Water and Topography Maps, or SWAT Maps in short form, are a soil-based layer for crop management. SWAT maps combine soil texture, water movement and topography to describe field behaviour into 10 consistent management zones. These zones are used to help quantify soil-based field variability. With the SWAT map, basic agronomy can be applied to manage crop inputs such as seeding rates, fertilizer/lime, and crop protection products. These inputs can be placed at rates where they will provide the optimal response in a given area of the field.
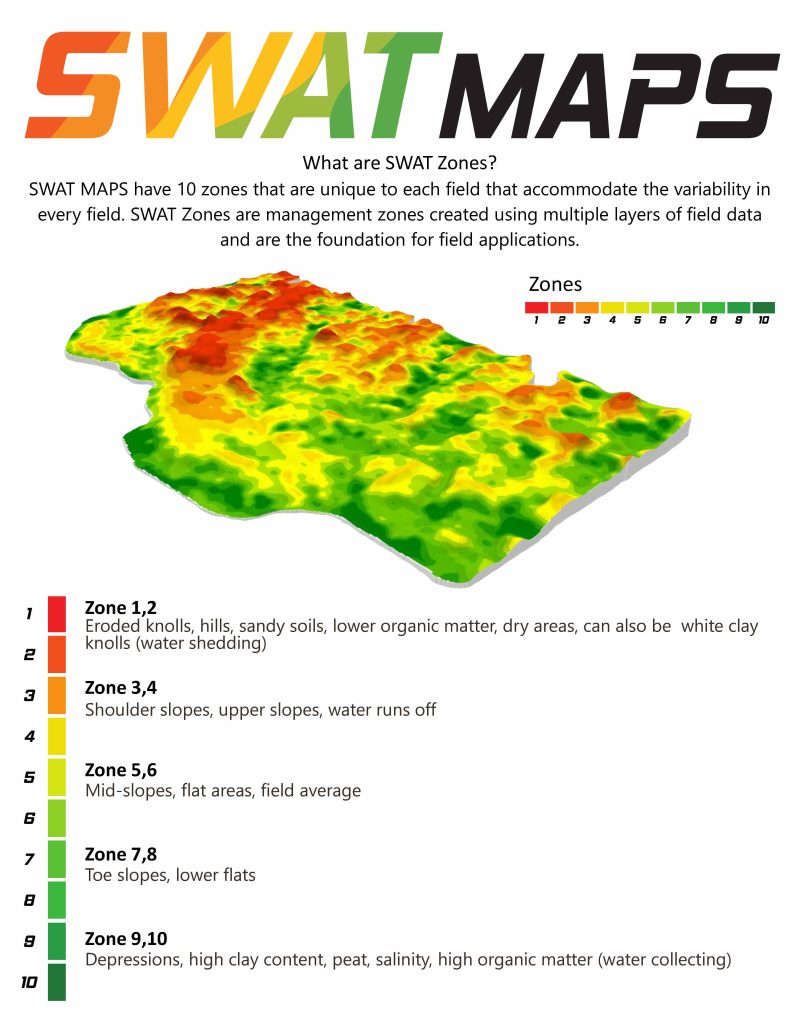
How SWAT zones differ. Image provided by Jonathan Zettler, CCA, on behalf of Sullivan Agro
Deb Campbell CCA-ON of Agronomy Advantage, Dundalk, Paul Sullivan CCA-ON of PT Sullivan Agro, Kinburn, and Jonathan Zettler, CCA-ON of Fieldwalker Agronomy Clifford, share why they and their clients see value in using SWAT Maps.
When Deb Campbell was looking to add a soil map to her agronomy toolbox, SWAT maps fit the bill. But what she found wasn’t just a soil map, it’s a new way of thinking about crop management. Deb mentions “I now have a process to start better crop management without having to use unreliable yield data. I can pull up to any farm, regardless of how long they have been using precision agriculture and give sound advice on how we can make changes over flat rate applications. I especially use the information when making long-term build programs for phosphate and potash. We can sort out where crop yields are going to be yield-limited relative to potential and adjust our programs accordingly. I can see strong environmental benefits for both N and P management using the SWAT map soil data.”
With SWAT maps Paul Sullivan has been able to help customers manage populations, nitrogen rates, and target-apply fungicides in corn. Paul comments that “SWAT maps have completely changed the way we think about crop management and our approach to soil sampling. We have a high-definition map that we can take anywhere within our trading area, and immediately apply our agronomy knowledge at a level we were unable to before.”
One 2021 example is from Midlee Farms in Osgoode, ON. By adjusting seeding and N rates to match soil and water potential, Paul found that he could maintain extremely consistent yields across the corn field, matching input response with the resources the field could provide. Even though there was a range of 28,000 to 34,000 seeds per acre, the corn yield ranged from 209 to 216 bu/acre.
The maps can also be used for adjusting seeding rates in other crops. Why do growers of edible beans ask for additional acres each year to be mapped? Jonathon Zettler says “They are able to target optimal seeding rates to microclimates within the field, thereby increasing or maintaining yield in some areas of the field and improving harvestability by reducing lodging and white mould. We can also push populations in areas of the field where the plants have less growth or reduced emergence, in an attempt to get row closure.” While these farmers see the benefits in edible beans, we are also able to use the map when the fields are in one of their other crops to optimize inputs.
Wrapping up, SWAT Maps are a foundational soil layer to enable crop management. They can be used to define field variability quickly and systematically. The approach allows service providers and farmers to have a common language for discussing and identifying how to optimize crop inputs.
Using this soil-based layer, the crop management approach ensures the farm has a trusted advisor to measure and execute on the observations and recommendations. It is not just about the map. It’s about what is the optimal rate to put within each zone on a field-by-field basis.
Back to Innovator ~~~ Next article ~~~ Previous article