Ontario Field Crop Report – June 22, 2022
Insect/Pest Update – Current Issues
Cereal leaf beetle (CLB) populations have reached threshold in some spring cereal fields this week (Figure 1). CLB larvae and adults feed on the tissue between leaf veins, leaving long scratch marks that can make plants appear silver or frosted from a distance. Before boot stage, the threshold is an average of three larvae per tiller. One CLB adult or larvae per stem warrants control after boot stage but prior to heading. Once headed, protecting from injury to the flag leaf is key in early heading stages. Control in early stages of heading is only warranted if CLB are still actively feeding directly on the flag leaf before the grain fill period (Zadok 75) is complete.
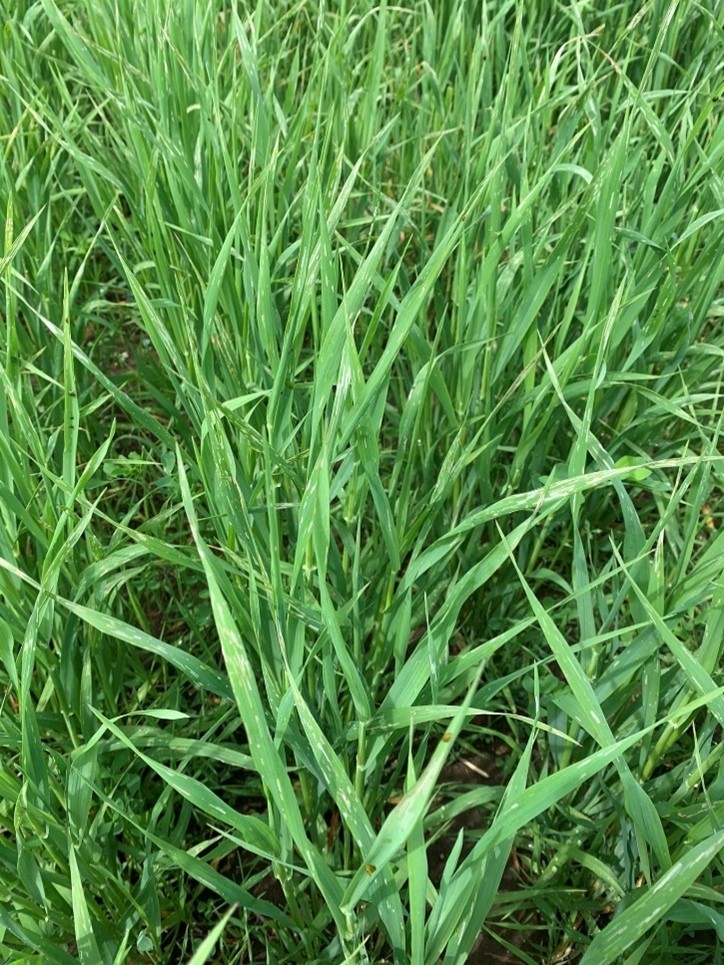
Figure 1. Significant cereal leaf beetle feeding injury in spring cereals. Photo credit: Deb Campbell, Agronomy Advantage Inc.
Thrip infestations have been spotted in a few corn fields again this year. Typically, not a pest of concern, thrips have become an annual problem for some corn, soybean and spring cereal fields in Ontario. These tiny cigar shaped insects feed on the underside of the leaves, leaving scars along the veins of the leaf (Figure 2). When young plants are stressed from lack of rain or a nutrient deficiency, thrips may thrive, moving beyond the lower leaves, causing feeding injury up to the newest leaves. No thresholds are available as typically the plants can grow ahead of the infestations. Control may only be warranted if infested fields continue to be significantly moisture stressed with no rain forecasted, and there are several thrips per leaf throughout the plant, but especially if thrips are causing injury on the newest leaves.
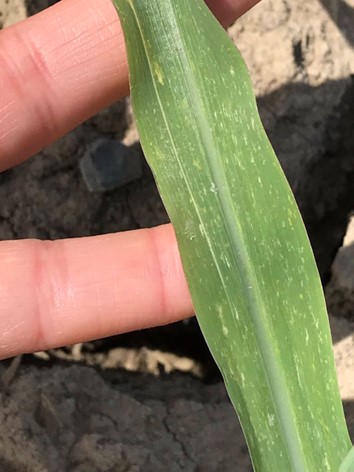
Figure 2. Thrips feeding scars run parallel to the veins of corn leaves. Photo credit: Susan Gowan, Gowan Consulting
Potential Upcoming Pest Issues
Two-spotted spider mite (TSSM) populations in Ontario soybeans and dry beans are becoming tolerant to dimethoate (Lagon® or Cygon®). Despite last year’s field season not being ideal for TSSM, samples were collected in ten fields in southwestern Ontario that had reached threshold. Populations from these sites were found to be resistant to dimethoate. In a hot dry year, we expect to see significant problems in soybeans and dry beans. Through a collaborative research project with Western University, AAFC – London and OMAFRA, we hope to understand the distribution and extent of this resistance. Currently, dimethoate is the only active ingredient registered for spider mites in soybeans and dry beansis very concerning, and increases our need to test these spider mite populations to find what possible alternative products are still effective and can be registered to replace dimethoate. If you find any spider mite populations in soybeans or dry beans before an application is made (preferable), or after a dimethoate application that was not successful at controlling the population, please contact Tracey Baute (tracey.baute@ontario.ca). Spider mite samples will be submitted to Western University for resistance testing. Fields with a history of spider mite problems or fields close to greenhouse operations are of special interest, since they could influence which control products they have been previously exposed to.
Corn rootworm (CRW) populations could be heavy again this year, as Bt resistant populations continue to spread and new counties are identified with problem fields. Hot, dry conditions, like forecasted over these next few weeks, are ideal for adult activity.In continuous corn fields with repeated use of Bt rootworm hybrids, monitor for beetles in July and August. Those fields that had heavy CRW adult pressure last year will have experienced abundant egg laying in late summer. The larvae that hatched from those overwintered eggs are happy to find corn roots planted in those same fields again this year. Look for signs of lodging and goosenecking by digging up the roots to determine the extent of the root feeding. Contact your seed provider or Tracey Baute, OMAFRA if unexpected damage in Bt rootworm hybrids is found.
The Regional Corn Rootworm Trap Network will continue in 2022 and we are looking for more trap participants in Ontario. Trap sites in continuous corn with a history of repeated use of Bt rootworm hybrids are preferred trap sites. If you are interested in getting free trap supplies in Ontario, please contact Tracey Baute (tracey.baute@ontario.ca) so we can get traps to you before July when trapping will start. Trap supplies are free to growers and crop consultants thanks to funding from the Grain Farmers of Ontario (GFO) and the Agricultural Biotechnology Stewardship Technical Committee (ABSTC). Monitoring sticky traps weekly during adult activity helps us gain insight as to whether it is a bad rootworm year and alerts us to regions and fields where rootworm activity may need further scouting and monitoring for potential resistance issues. It is also improving our understanding of where both northern and western CRW populations are in Ontario and across North America.
Weather Data
| Location & Year | Weekly June 13 – 19 2022 | Accumulated | |||||
| Highest Temp (°C) | Lowest Temp (°C) | Rain (mm) | Rain (mm) April 1st | GDD 0C April 1st | GDD 5C April 1st | CHU May 1st | |
| Harrow 2022 | 33.3 | 15.3 | 15.4 | 205 | 1021 | 669 | 961 |
| Harrow 2021 | 28.7 | 8.8 | 12.8 | 143 | 1096 | 714 | 943 |
| Harrow 10 YR Avg. (2011-20) | 27.6 | 12.7 | 18.9 | 237 | 1065 | 668 | 998 |
| Ridgetown 2022 | 33.7 | 11.8 | 3.3 | 174 | 951 | 606 | 874 |
| Ridgetown 2021 | 27.1 | 5.5 | 13.4 | 135 | 1023 | 650 | 891 |
| Ridgetown 10 YR Avg. (2011-20) | 27.0 | 11.0 | 19.9 | 208 | 988 | 596 | 919 |
| London 2022 | 32.0 | 8.9 | 0.4 | 181 | 924 | 583 | 841 |
| London 2021 | 26.0 | 4.0 | 8.2 | 135 | 1021 | 652 | 864 |
| London 10 YR Avg. (2011-20) | 27.3 | 10.6 | 16.0 | 224 | 971 | 582 | 905 |
| Brantford 2022 | 32.2 | 9.1 | 8.1 | 169 | 914 | 568 | 808 |
| Brantford 2021 | 29.1 | 5.0 | 2.9 | 122 | 1001 | 631 | 852 |
| Welland 2022 | 31.1 | 13.0 | 2.2 | 189 | 959 | 603 | 859 |
| Welland 2021 | 28.2 | 5.7 | 8.1 | 93 | 992 | 619 | 839 |
| Welland 10 YR Avg. (2011-20) | 27.1 | 10.8 | 12.4 | 229 | 971 | 581 | 898 |
| Elora 2022 | 30.2 | 7.4 | 0.0 | 163 | 841 | 508 | 742 |
| Elora 2021 | 26.7 | 3.6 | 21.6 | 119 | 912 | 551 | 768 |
| Elora 10 YR Avg.
(2011-20) |
25.9 | 9.2 | 13.8 | 222 | 853 | 478 | 784 |
| Mount Forest 2022 | 31.2 | 6.9 | 0.0 | 179 | 850 | 523 | 770 |
| Mount Forest 2021 | 25.5 | 3.9 | 1.3 | 102 | 921 | 563 | 778 |
| Mount Forest 10 YR Avg. (2011-20) | 25.3 | 8.9 | 18.0 | 211 | 837 | 469 | 777 |
| Peterborough 2022 | 30.1 | 8.9 | 13.1 | 212 | 845 | 497 | 761 |
| Peterborough 2021 | 27.5 | 3.7 | 15.3 | 106 | 902 | 531 | 760 |
| Peterborough 10 YR Avg. (2011-20) | 26.9 | 7.6 | 15.3 | 216 | 865 | 489 | 794 |
| Kemptville 2022 | 29.5 | 10.4 | 0.6 | 272 | 923 | 555 | 835 |
| Kemptville 2021 | 29.0 | 7.5 | 43.5 | 142 | 1012 | 635 | 840 |
| Kemptville 10 YR Avg. (2011-20) | 27.5 | 9.4 | 13.4 | 217 | 903 | 529 | 838 |
| Earlton 2022 | 28.8 | 10.2 | 15.5 | 159 | 737 | 439 | 725 |
| Earlton 2021 | 30.3 | 3.8 | 4.7 | 84 | 858 | 506 | 711 |
| Earlton 10 YR Avg. (2011-20) | 24.8 | 6.6 | 17.7 | 180 | 655 | 364 | 647 |
| Sudbury 2022 | 27.4 | 9.7 | 2.8 | 187 | 732 | 424 | 692 |
| Sudbury 2021 | 26.0 | 4.5 | 14.9 | 135 | 859 | 509 | 722 |
| Sudbury 10 YR Avg. (2011-20) | 25.2 | 8.2 | 13.4 | 198 | 721 | 406 | 699 |
| Thunder Bay 2022 | 22.4 | 8.1 | 6.2 | 308 | 537 | 266 | 485 |
| Thunder Bay 2021 | 30.0 | 5.1 | 0.4 | 185 | 734 | 396 | 648 |
| Thunder Bay 10 YR Avg. (2011-20) | 23.6 | 5.5 | 21.3 | 185 | 594 | 290 | 542 |
| Fort Frances 2022 | 24.1 | 12.0 | 28.4 | 329 | 586 | 317 | 578 |
| Fort Frances 2021 | 27.9 | 5.0 | 3.0 | 145 | 799 | 455 | 745 |
| Fort Frances 10 YR Avg. (2011-20) | 23.6 | 7.1 | 27.5 | 189 | 689 | 367 | 660 |
| Report compiled by OMAFRA using Environment Canada data. Data quality is verified but accuracy is not guaranteed. Report supplied for general information purposes only. An expanded report is available at www.fieldcropnews.com. | |||||||
Crop Report – June 15, 2022
Soybean Update
Soybeans range from emergence (VE) to the fourth trifoliate leaf stage. The majority of the crop was planted in May, although sporadic showers meant that some fields could not be planted until June. A few soybeans were planted in April. They are now at the fifth trifoliate leaf stage. Ideally, soybeans should have 6 trifoliates by the time they begin to flower to maximize yield potential.
What is the Critical Weed Free Period?
Soybeans are susceptible to yield losses from weed competition, especially when they are small. The critical weed free period is the time during the growing season when uncontrolled weeds cause the greatest yield loss. Yield losses from the presence of living weeds during this time are irreversible. This makes early season weed control essential.
There are several factors that dictate the exact length of the critical weed free period, such as weed density, weed species, and when the weeds emerge. It’s well documented that if weeds are not controlled by the first trifoliate, yields will decline rapidly each day they are not sprayed. Studies have shown that beginning from the first trifoliate, uncontrolled weeds can reduce yield by 0.5 to 2 bu per acre per day. The first trifoliate to the third trifoliate growth stage is considered the “critical weed free period” since the presence of weeds during this time causes the highest yield losses. In wide rows or low plant populations, the weed free period is slightly longer.
The best strategy to reduce yield losses is to always start with a clean field at planting, either through tillage or an herbicide application. It’s important to know that weeds that emerge at the same time as the crop cause the greatest amount of competition and yield reduction, which is partly why many growers use a soil applied residual herbicide in addition to Roundup. Later emerging weeds have less of an impact on final yield. As a rule of thumb, the first in crop application should be made approximately 21-28 days after seeding.
Is it Too Late to Apply Potash?
Potassuim (K) and Manganese (Mn) deficiency are already evident this year. These two nutrient deficiencies have unique leaf symptoms. K deficient leaves turn yellow along the leaf margins (see Figure 1.), while Mn deficient leaves turn yellow across the whole leaf, except for the veins which remain green (see Figure 2.).

Figure 1. Potassium (K) deficient leaves turn yellow along the leaf margins
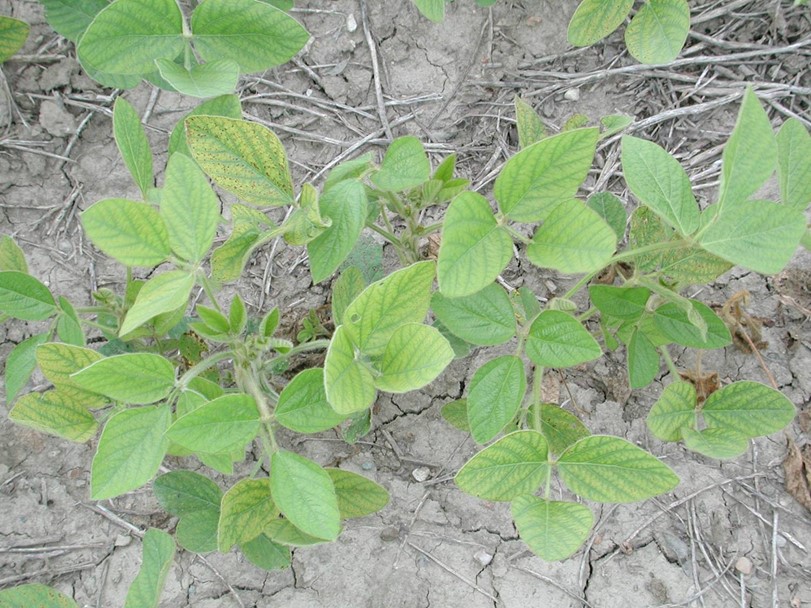
Figure 2. Manganese (Mn) deficient leaves turn yellow across the whole leaf, except for the veins which remain green
A soil test is the only reliable way to know if a field is truly low in K or if the plants are just showing stress-induced potassium deficiencies. K deficiency symptoms may also indicate soybean cyst nematode (SCN) feeding on the roots. If the soil test is poor for K (less than 100 ppm) a broadcast application at this time is still warranted as a remedial management strategy. Soybeans are very responsive to potash and have the ability to utilize surface applied potash even after planting.
Manganese Deficiency
One of the most significant factors affecting the availability of Mn is the soil pH. As soil pH increases, less Mn is available to the plant. The deficiency is most common on poorly drained soils, especially clays. The amount of air in the soil also impacts available Mn, so tire tracks often show less Mn deficiency. High organic matter also ties up Mn. Since Mn is a micronutrient, a foliar application of Mn works well to rectify the deficiency and can provide a 5+ yield response.
Replants
Many soybean fields are struggling this year to achieve a perfect stand. Keeping an existing stand is often more profitable than replanting at this date. The uniformity of the existing crop is more important than having a high population. Soybeans have an impressive ability to compensate for thin stands under good growing conditions. Soybean plants can fill spaces up to 30 cm (12 inches) within or between rows with relatively little yield reduction. Research has shown that a final stand of 90 000 plants per acre in 7.5-inch rows provides a yield potential of 90 percent. Plants must be healthy, evenly distributed and weed free for low populations to flourish. Field experience has shown that more plants per acre are needed on clay soils. A minimum stand of about 110 000 plants per acre on heavy clay soils is required to achieve good yields. When thickening a poor stand, use the same variety. These later planted seeds will mature within 10 days of the original stand even though they may have been seeded a month later in the spring.
Weather Data
| Location & Year | Weekly June 6 – 12, 2022 | Accumulated | |||||
| Highest Temp (°C) | Lowest Temp (°C) | Rain (mm) | Rain (mm) April 1st | GDD 0C April 1st | GDD 5C April 1st | CHU May 1st | |
| Harrow 2022 | 27.4 | 11.4 | 33.1 | 189 | 924 | 592 | 844 |
| Harrow 2021 | 29.8 | 12.8 | 6.3 | 130 | 956 | 610 | 772 |
| Harrow 10 YR Avg.
(2011-20) |
25.9 | 12.1 | 15.7 | 218 | 923 | 561 | 822 |
| Ridgetown 2022 | 25.9 | 9.3 | 42.1 | 170 | 859 | 534 | 765 |
| Ridgetown 2021 | 29.2 | 11.1 | 7.1 | 122 | 897 | 559 | 740 |
| Ridgetown 10 YR Avg. (2011-20) | 25.6 | 11.0 | 9.1 | 188 | 855 | 497 | 755 |
| London 2022 | 24.5 | 8.1 | 30.2 | 181 | 833 | 513 | 733 |
| London 2021 | 30.4 | 12.6 | 7.8 | 127 | 898 | 565 | 717 |
| London 10 YR Avg.
(2011-20) |
25.2 | 10.3 | 18.6 | 208 | 837 | 483 | 742 |
| Brantford 2022 | 25.0 | 7.8 | 31.5 | 161 | 827 | 501 | 706 |
| Brantford 2021 | 31.8 | 13.4 | 4.8 | 120 | 872 | 538 | 702 |
| Welland 2022 | 26.2 | 10.1 | 41.0 | 186 | 876 | 540 | 758 |
| Welland 2021 | 29.7 | 14.5 | 3.0 | 85 | 866 | 527 | 686 |
| Welland 10 YR Avg.
(2011-20) |
25.0 | 9.8 | 20.8 | 216 | 838 | 483 | 736 |
| Elora 2022 | 23.9 | 7.9 | 38.3 | 163 | 761 | 448 | 648 |
| Elora 2021 | 31.3 | 12.3 | 3.3 | 97 | 793 | 468 | 628 |
| Elora 10 YR Avg.
(2011-20) |
24.0 | 8.7 | 20.4 | 208 | 731 | 390 | 637 |
| Mount Forest 2022 | 23.7 | 8.3 | 46.3 | 179 | 768 | 461 | 672 |
| Mount Forest 2021 | 30.4 | 12.0 | 2.7 | 100 | 806 | 483 | 643 |
| Mount Forest 10 YR Avg. (2011-20) | 24.2 | 8.7 | 22.4 | 193 | 716 | 383 | 631 |
| Peterborough 2022 | 22.9 | 6.9 | 80.6 | 199 | 769 | 441 | 672 |
| Peterborough 2021 | 30.6 | 8.6 | 1.0 | 91 | 784 | 448 | 622 |
| Peterborough 10 YR Avg. (2011-20) | 24.7 | 7.8 | 26.2 | 201 | 744 | 403 | 652 |
| Kemptville 2022 | 24.0 | 7.3 | 29.2 | 271 | 845 | 497 | 741 |
| Kemptville 2021 | 32.0 | 9.6 | 0.6 | 98 | 888 | 545 | 693 |
| Kemptville 10 YR Avg.
(2011-20) |
24.9 | 9.3 | 25.0 | 204 | 779 | 439 | 690 |
| Earlton 2022 | 23.7 | 6.2 | 30.5 | 144 | 660 | 381 | 632 |
| Earlton 2021 | 33.7 | 5.2 | 1.2 | 79 | 744 | 428 | 584 |
| Earlton 10 YR Avg.
(2011-20) |
23.4 | 6.2 | 15.7 | 162 | 543 | 286 | 516 |
| Sudbury 2022 | 23.1 | 7.9 | 46.2 | 184 | 658 | 371 | 604 |
| Sudbury 2021 | 31.6 | 9.7 | 23.2 | 120 | 743 | 428 | 586 |
| Sudbury 10 YR Avg.
(2011-20) |
23.2 | 8.0 | 12.7 | 185 | 601 | 322 | 557 |
| Thunder Bay 2022 | 25.1 | 3.1 | 4.3 | 302 | 482 | 231 | 427 |
| Thunder Bay 2021 | 31.5 | 4.1 | 29.8 | 185 | 615 | 312 | 511 |
| Thunder Bay 10 YR Avg. (2011-20) | 22.3 | 5.2 | 12.7 | 164 | 491 | 222 | 426 |
| Fort Frances 2022 | 24.1 | 2.4 | 2.9 | 301 | 516 | 267 | 492 |
| Fort Frances 2021 | 32.1 | 3.9 | 30.8 | 142 | 684 | 375 | 614 |
| Fort Frances 10 YR Avg. (2011-20) | 24.0 | 6.3 | 29.6 | 162 | 575 | 289 | 525 |
| Report compiled by OMAFRA using Environment Canada data. Data quality is verified but accuracy is not guaranteed. Report supplied for general information purposes only. An expanded report is available at www.fieldcropnews.com. | |||||||
GDD 0C – accumulated Growing Degree Days above 0 Degrees Celsius since April 1, 2022
GDD 5C – accumulated Growing Degree Days above 5 Degrees Celsius since April 1, 2022
CHU – Crop Heat Unit calculated from minimum and maximum temperatures since May 1, 2022